New 3D Model Lets Researchers Visualize Microbiome in a CF Lung, Study Shows

A new tool allows researchers and doctors to visualize a 3D model of a cystic fibrosis (CF) lung that incorporates information about microbes, which may help improve targeted drug delivery, a new study shows.
The study, “Three-Dimensional Microbiome and Metabolome Cartography of a Diseased Human Lung,” was published in the journal Cell Host & Microbe.
Human organs are very complex and can vary greatly depending on external factors such as temperature, and chemical conditions such as oxygen availability and pH.
These conditions can lead to the establishment of different subpopulations of microorganisms, which include bacteria. Genome sequencing of the parts of a lung have shown there is significant variation in the bacterial populations across different parts of a single lung.
“Our understanding of the spatial variation of the chemical and microbial make-up of a human organ remains limited,” Pieter Dorrestein, PhD, professor at the Skaggs School of Pharmacy and Pharmaceutical Sciences at the University of California San Diego (UCSD), said in a press release.
“This is in part due to the size and variability of human organs, and the sheer amount of data we get from metabolomics and genomics studies,” he said.
Studies that analyzed every location within the lungs have shown diverse groups of microorganisms. However, scientists were still unable to directly visualize microbes and microbial molecules within the lung, as well as how microbial populations were affected spatially by exposure to antibiotics.
This led UCSD researchers to develop an open-source 3D spatial visualization tool for mapping different types of data onto whole organs. This enabled the team to visualize the variation of microbes and microbial metabolism molecules in a cystic fibrosis patient’s lung.
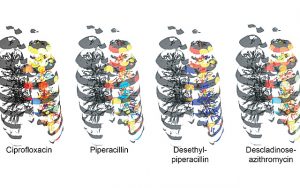
Researchers developed a workflow that allowed them to map the microbiome and associated metabolic data onto a 3D reconstruction of CT scans. They did this by obtaining a lung from a CF patient and sectioning it, then analyzing each section for microorganisms, their metabolites, and the antibiotics the patient was administered during treatment.
Researchers then used a Google Chrome extension called “ili” to visualize the microorganisms and their metabolites across the entire lung.
“The application enables the user to map data onto a 2D or 3D surface, so we modified the code to allow us to map the abundance data not only onto surfaces, but also within the model,” said Dr. Neha Garg, lead author of the paper.
The data obtained of the microorganisms and their metabolites in a CF lung, which included 56 microbes and 16,379 molecules, were then superimposed on the 3D lung image built from CT scans, to create a visualization tool.
Researchers were then able to make previously unknown observations.
“We could see that one of the antibiotics administered to the patient prior to collecting the tissue did not penetrate the bottom of the lung — a phenomenon that has not been observed before,” Garg said. “This correlated with a higher abundance of the cystic fibrosis-associated pathogen Achromobacter.”
“Thus, different drugs may differentially penetrate the lung, limiting exposure to effective dosage,” she said. “Our tool allows researchers and clinicians to visualize this significant clinical concern within a human organ for the first time. This has implications for treatment of CF and other diseases.”
Researchers hope their tool can be extended to aid research in other diseases.
“As future studies unravel more about the microbiome and metabolome, their spatial visualization will provide a means to infer their biological significance,” Dorrestein said. “Furthermore, the methodology developed can be extended to any human organ — notably those with tumors, which are known to be associated with their own unique microbiomes.”


