Cystic Fibrosis News Community › Forums › COVID-19 and CF › “Risk Assessment in an Ever-Changing World”
Tagged: Covid, life with cf, risk, vaccination
-
“Risk Assessment in an Ever-Changing World”
Posted by Community Member on July 7, 2021 at 3:15 pmI recently read this post on the CF Foundation Community Blog and thought it was relevant to some of the conversations we’ve been having here: Risk Assessment in an Ever-Changing World | CF Foundation
Included in the article, this risk assessment tool (which represents the author’s personal risk assessment) is a helpful way to think about activities and their associated risk.
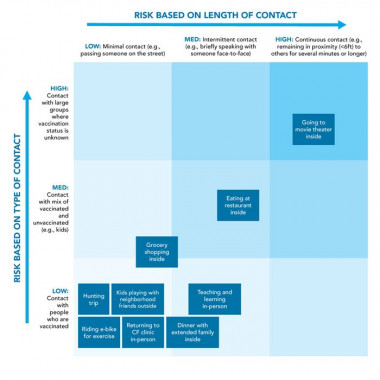
What are your personal risk assessment strategies? How are you choosing which activities to participate in and those to steer clear of? How “back to normal” are you at this point?
(photo courtesy of CFF.org)
Community Member replied 2 Members · 4 Replies -
4 Replies
-

Community Member
MemberThank you Jenny, for pointing at this. It is an interesting attempt to visualize the risk of getting infected by covid in certain situations.
However, looking at it closer, there are a few remarks to be made.
First of all, filling in the 9 “risk-blocks” is largely subjective and depends on the assessment of the user personally. For instance, the author of the article “thinks” that visiting the cf-center in person is in the low area of risk, both considering duration and type of contact. There is no way of knowing this however. If we look at the descriptions for the different blocks, a visit to our doctor in the cf center could as easily be placed in the bottom right corner, because such contacts tend to take longer than a few minutes and are in close proximity. And it hard to know which of the medical personnel is actually vaccinated or not. So it might as well be placed in the upper right hand corner, being a very high risk situation if we are so unlucky to be in the same examination room with an unvaccinated nurse during (for instance) an upper abdominal ultrasound. The same goes for eating in restaurants inside, or extended diners with family inside. It is unclear why the author chose to place those situations in the boxes as he did.
The second consideration regards the “mixed” situations. A contact with vaccinated people is in the “low”-type row of the diagram, but if it takes a long time and is within 6 ft, it is also in the ‘high”-length column. What to think of this, high or low risk? Or in-between?
The third problem is that the actual risk is hard to assess. One can perhaps say some situations are more risky than others, but how risky exactly is still unknown. Most of the covid vaccine trials that were held last year to determine the effectiveness of the vaccines, showed a general risk of getting covid in the unvaccinated group of about 1%. This was during an observation period of several weeks, in a randomized group of people, in an area where covid was present (but how present?). In the vaccinated group this risk could get as low as 0.04%, so 25 times lower. But still, what do these figures mean in real life? How does our personal behavior compare to the average randomized group members? What extra risks does our personal health situation bring to the table? How is the current infection rate in our area compared to the tested area? Are we and/or our contacts wearing a facemask and if so, an adequate one?
To “improve” on the diagram, one could give each of the 9 squares a number from 1 to 9. 1 being the lowest risk situation, 9 the highest. This would at least in some way take care of my second problem.
A quick sketch I hastily made would look like this.
5 7 9
3 5 7
1 3 5
But still, diagrams and tools like this, in my opinion, tend to only provide some feeling of false security.
Not knowing the actual risks or the protective value of the vaccines, given the emergence of ever new mutations, we tend to be on the very cautious side of things still, even after being vaccinated. We go from the premise that our contacts are asymptomatically infected and we take measures to protect ourselves. This can mean wearing a good mask, limiting the time of contact, not meeting indoors, or in some cases even not having the contact at all.
-
Community Member
MemberPaul, I agree that these diagrams can provide a false sense of security. I remember seeing a diagram similar to this one last summer that said outdoor barbecues with friends and family would be considered very low risk — something I strongly disagreed with.
I do however think it’s an interesting exercise, as you said. The points illustrated (type of contact, length of contact) are things I’ve taken into consideration when deciding what activities I’m comfortable with. I also found the authors commentary in the original article to be interesting.
Another thing I’ve taken into consideration is the number of cases in our area. I’ve kept track of it closely since the beginning of the pandemic. Once numbers start to change, we adjust accordingly. It’s all very subjective, isn’t it? While we’ve become more comfortable with certain things, we are still more careful and do far less than many people in my area.
-
Community Member
MemberTalking about the number of cases: I was just browsing the news, statistics of a 1800% rise (!) in covid infections in two weeks time. This is no typo.
It happened after the Dutch government lifted almost all restrictions on 26 June and the minister of health encouraged young people to go and party from day one after their Johnson vaccination (“dancing with Johnson” he called it – in the Dutch language this rimes). Inadequate entrance control at festivals and nightclubs, and fraude with covid-certificates provided the fuel for the rest of this disaster. Infections per day rose from 550 to more than 10.000 yesterday, predominantly in the age group 18-24, most of them caused by the delta mutation.
-
Community Member
MemberOh, wow, Paul! That is terrifying! We’re currently seeing a rise in cases in my state, mostly in unvaccinated individuals. 99% of our recent COVID deaths have been unvaccinated people. These things are reminders that we are far from over this pandemic.
-
-
Log in to reply.